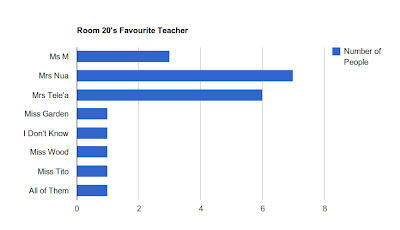
Room 20 has been learning about Statistics. Mrs Nua has taught us how to make graphs. For this we had to create a form and ask people a question you wanted to know. I wanted to know what Room 20's Favourite Teacher was.
I sent out a form to all the pupil in room 20 and collected the data. As soon as I had done that, I turned it into a tally chart via Google Spreadsheet. I used all of this data and converted it into a bar graph. I chose to do a bar graph because I thought it was the best way to express my information.
If you see the picture above then you will see the graph I made using Google Docs.
Denver Broncos Jerseys, nhl camo jerseys, new nba hoodies jerseys, Christian Louboutin Outlet, Winter Olympics Jerseys, Dallas Stars Jerseys, CHL Jerseys, Florida Panthers Jerseys, Buffalo Sabres Jerseys, New York Jets Jerseys, St Johns IceCaps Jerseys, Edmonton Oilers Jerseys, Christian Louboutin UK, Christian Louboutin Sneakers, NFL Hoodies Jerseys, Columbus Blue Jackets Jerseys, 2015 New Jerseys, Christian Louboutin Slingbacks, Oakland Raiders Jerseys, Christian Louboutin Mary Jane Pumps, Baltimore Ravens Jerseys
ReplyDelete